
Ever spent hours building something with blocks, only to realize you need to start over because the base wasn’t right? That’s exactly what happens to many businesses during data modeling in Power BI . They build reports and dashboards, but the foundation underneath keeps causing problems.
The numbers tell a shocking story: data scientists typically spend 80% of their time preparing data and only 20% analyzing it to find useful information. The good news is that Microsoft Fabric and AI are starting to flip this situation around. In this article, we will explore how these technologies are transforming the way users work with data in Power BI.

Where Do Legacy Power BI Data Models Fall Short?
Legacy data models often struggle with several roadblocks. Given below are some common obstacles that make it tricky to support evolving business requirements, implement new features, and respond quickly to changing market conditions.
1. Outdated Design and Structure
Old data models were built many years ago using methods and logics that don’t work well for contemporary business needs. These structures were designed for smaller amounts of data and simpler business processes. Updating them is difficult because changing one part can break many other connected pieces throughout the system.
2. Poor Documentation
Power BI wasn’t built with documentation in mind. Its PBIX files hide everything inside a binary format. Because of this, teams usually fall back on screenshots, Word documents, and internal knowledge to maintain understanding. This approach becomes a major risk when models become complex or a company grows. If a developer leaves, they take the “unwritten rules” of the system with them. And the rest of the team struggles to understand complex formulas and track important changes.
3. Rigid and Inflexible Structure
Legacy data models are built in fixed ways that can’t easily adapt when business requirements evolve. Adding new types of information or changing existing structures takes a lot of time and technical work. The rigid design makes it difficult to support new products, services, or workflows. Companies often feel stuck since their data structure can’t evolve with the pace at which their business grows.
4. Data Duplication
Old systems often store the same information in multiple places across different tables and databases. This duplication wastes storage space and creates confusion about which version of the data is correct. When updates happen in one place, they might not happen everywhere else. Managing all these duplicate copies becomes a constant headache for the users maintaining the system.
5. Complex Relationships and Dependencies
Legacy data models have grown over time with layers of complicated connections between different data pieces. These tangled connections make it hard to understand how changing one thing will affect everything else. Simple updates can break unexpected parts of the system because of hidden dependencies. Tracking all these connections requires deep technical knowledge that many employees in the company don’t have.
6. Performance Issues and Slow Queries
Old data models weren’t designed to handle the large amounts of information that companies work with today. Running reports or searching for data takes a long time and sometimes crashes the system completely. The way data is organized makes the computer work harder than necessary to find and process information. Poor performance frustrates users and wastes valuable time that could be spent on actual work.
Leading Airport Retailer Modernized Their Data Warehouse Architecture Through AWS and Power BI Integration to Achieve a 30% Improvement in Decision-Making Speed
7. Inconsistent Naming Conventions
Different parts of legacy data models use inconsistent names for similar types of information. The same thing might be called by different names in various tables or databases. Some names are abbreviations that nobody understands anymore or make no sense to new team members. This inconsistency makes it difficult for teams to find the data they need or understand what they are looking at.
8. Limited Scalability for Growth
Old data models struggle when more users access the system. They were not built to grow beyond their original size and purpose. Adding more users causes the system to slow down significantly or stop working properly. Companies often struggle when their data structure simply can’t support their business growth without major rebuilding.
9. Security Vulnerabilities
Legacy data models often lack modern security features that protect sensitive information from unauthorized access. The old security methods have known weaknesses that hackers can exploit to steal company or customer data.
Updating security in legacy systems is complicated because new protection methods don’t integrate well with outdated architectures. Companies face serious risks of data breaches that could damage their reputation and finances.
10. Data Quality and Accuracy
Legacy data models lack robust built-in checks to ensure information is correct, complete, or entered properly. Incorrect data gets stored and spreads throughout the system without anyone noticing until problems appear later.
Also, there are no automated ways to catch mistakes or verify that data makes sense before it’s saved. Poor-quality data leads to poor business decisions and wastes time fixing errors after they’ve already caused damage.
11. Difficulty in Understanding Business Logic
The business rules and logic embedded in legacy data models are often unclear or implemented in confusing ways. Understanding why data is structured a certain way or what business process it supports takes extensive investigation.
Changes in business operations over the years have left outdated logic in the system that no longer applies. Furthermore, figuring out what can be safely changed versus what needs to stay is a complicated puzzle.
12. Integration Difficulties with New Systems
Modern software and tools struggle to connect with legacy data models because they use different technologies and standards. Getting new applications to read or write data in old formats requires additional custom programming.
These integration problems prevent companies from using helpful new tools that could improve their business operations. The disconnect between old and new systems creates information silos that block smooth data flow.
Democratize Data with Power BI for Informed Decision-Making
How Does Microsoft Fabric Integration with Power BI Redefine Data Modeling?
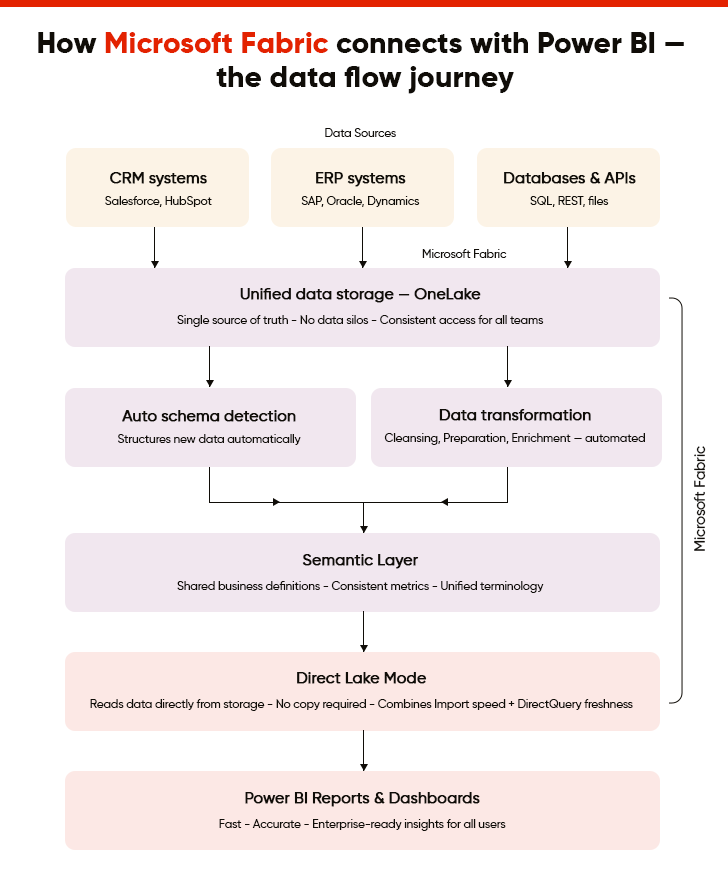
Microsoft Fabric transforms Power BI data modeling through unified storage, automated workflows, and direct lake connectivity. Discover how this powerful integration enhances enterprise-wide reporting and advanced analytics capabilities.
I. Unified Data Storage and Access
Microsoft Fabric brings data together in one unified data lake, OneLake, that Power BI can access directly without moving files around. In other words, users no longer need to copy data from different locations because everything is stored in the same storage system. This approach means everyone works with the same information and gets consistent results. Power BI can pull data from this single source instantly, making reports faster and more reliable for all users.
II. Simplified Data Transformation Workflows
Microsoft Fabric supports over 170 data sources and makes it much easier to clean, organize, and prepare data before it reaches Power BI for reporting. The tool works together smoothly, so users can transform messy data into useful information with fewer steps. Complex data preparation tasks that used to take hours can now happen automatically in the background. This simplification means more users can work with data without requiring advanced technical skills or programming knowledge.
III. Automatic Schema Detection and Updates
The system can automatically figure out the structure and format of new data without requiring manual setup or configuration. When data sources change or add new fields, Power BI models can update themselves to include this new information. This automatic detection saves time and reduces errors that occur when teams manually define data structures. As a result, users spend less time on technical setup and more time actually analyzing information for their work.
IV. Scalable Performance for Large Datasets
Microsoft Fabric employs lakehouse architecture and can handle huge amounts of data smoothly, enabling Power BI reports to load quickly, even when working with millions of records. The system automatically manages computer resources to ensure optimal performance, regardless of how much data teams analyze.
Moreover, users don’t experience slowdowns or crashes when reports need to process large volumes of information. This scalability means businesses can grow without worrying about their reporting tools becoming too slow to use effectively.
V. Direct Lake Mode for Faster Queries
Direct Lake is a storage mode in Fabric that allows Power BI to query data directly from One Lake without needing to copy it first into a separate database. This direct connection eliminates waiting time and reduces the storage space needed for reports and dashboards. Queries run faster because the system skips unnecessary data movement steps that used to slow everything down. As a result, users get their answers faster, helping them make decisions and complete their work more efficiently.
“With Direct Lake, we’re changing the game for data modeling in Power BI, offering the performance of Import mode with the timeliness of DirectQuery, directly from your data lake.”
– Kasper de Jonge, Principal Product Manager at Microsoft
VI. Streamlined Data Lineage Tracking
The system automatically tracks where data comes from, how it changes, and where it goes throughout the organization. Users can see the complete journey of any piece of information from its source to the final report. This visibility helps teams understand and trust the data they are using for important business decisions. Tracking data lineage also makes it easier to find and fix problems when something doesn’t look right.
VII. Integrated Machine Learning Capabilities
Microsoft Fabric brings smart prediction tools directly into the Power BI data modeling process. Users can add intelligent features to reports without requiring separate specialized software or moving data around. These capabilities help identify patterns and trends that might not be obvious just by looking at numbers. Business users can leverage advanced analytics without requiring deep technical expertise in complex statistical methods.
VIII. Simplified Multi-Source Data Integration
Connecting data from many different business systems and sources becomes much easier with this integrated approach. Microsoft Fabric handles the complex work of collating information from various places, so Power BI gets clean, combined data. Furthermore, users don’t need to write complicated code or maintain custom connections for each different data source. This simplification allows companies to bring together all their information for complete insights across the entire business.
IX. Automated Data Refresh Management
The system automatically updates data according to schedules, without requiring manual intervention or monitoring. As a result, Power BI will always have fresh information ready when users open their reports and dashboards. Moreover, failed refreshes are detected and fixed automatically, or an alert is sent to the right team if human intervention is needed. This automation reduces the technical maintenance work and ensures everyone always has current, accurate information.
X. Consistent Semantic Layer Creation
Microsoft Fabric helps build a common understanding of business terms and definitions that everyone in the company uses. This shared language ensures that words like “sales” or “customer” mean the same thing across all reports and departments. Power BI models inherit this consistency, so different teams don’t create conflicting reports about the same business metrics. Having a single agreed-upon definition for business terms eliminates confusion and improves decision-making across the organization.
The Definitive Guide to Building Interactive Power BI Dashboards
How Does AI Integration Revolutionize Power BI Data Modeling?
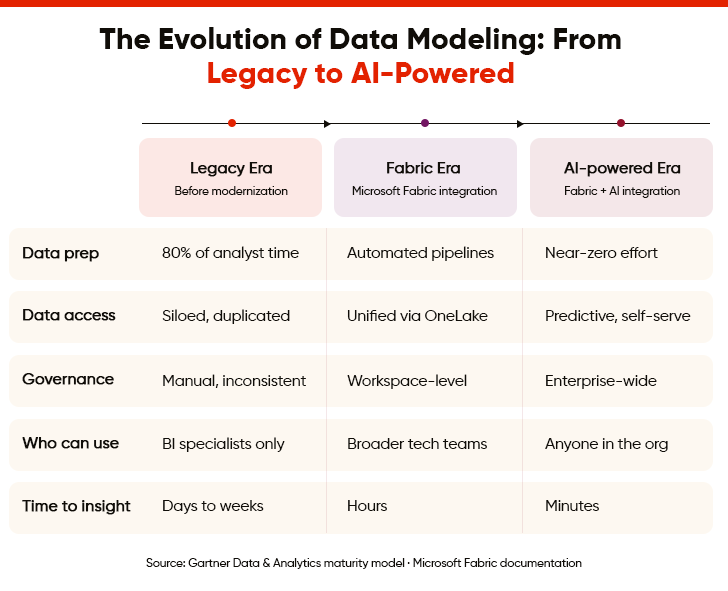
AI transforms Power BI data modeling through intelligent automation, quality monitoring, and pattern recognition, enabling faster insights while reducing manual effort and improving data reliability.
1. Intelligent Data Quality Monitoring
Poor data quality causes a quarter of organizations to lose more than $5 million annually. AI now addresses the issue by constantly monitoring data for mistakes, missing information, or unusual patterns that might indicate problems. It can detect errors automatically and alert teams before bad data causes issues in Power BI reports. This continuous monitoring helps maintain high data quality without requiring constant manual checks from teams.
2. Automated Data Summarization and Aggregation
AI automatically determines the best ways to group and summarize large amounts of detailed data for reporting purposes. It figures out which summaries and totals will be most useful based on how teams use the data. The system creates these aggregations in the background, making Power BI reports run faster without losing important details. Moreover, users get quick access to summary information while still being able to drill down into specifics when needed.
3. Anomaly Detection and Alert Systems
AI spots unusual patterns or unexpected changes in data that might indicate errors or important business events. It learns what normal data behaviour looks like and flags anything that deviates significantly from these patterns. The system can send automatic alerts when it detects problems or interesting trends that need attention. Early detection helps businesses respond quickly to issues before they become serious problems or missed opportunities.
4. Smart Data Categorization and Grouping
AI automatically organizes data into logical categories and groups based on content and meaning rather than just technical structure. It understands the business context of information and creates groupings that make sense for reporting purposes. This intelligent organization makes it easier for users to find and work with the data they need. The system can also suggest category structures that align with how businesses operate and make decisions.
5. Automated Data Model Documentation
AI generates clear explanations and documentation for Power BI data models automatically as users build them. It describes what each table, field, and relationship does in simple, understandable language. The system automatically updates documentation when the model structure changes. This automatic documentation helps new team members understand Power BI models quickly and makes maintenance much easier over time.
How Does the Future of Microsoft Fabric + AI Integration for Power BI Data Modeling Look Like?
“Thirty years ago, we had Word, which had to compete with Word Perfect, and Excel, which competed with Lotus. Then we realized that the real opportunities didn’t lie in those individual products, but in helping customers with their productivity. That’s why we created Office. It’s not just a bundle of different components, but products that work together and offer a single, uniform experience. We’re now doing exactly the same thing with Fabric.”
Arun Ulag, President, Azure Data at Microsoft
Microsoft Fabric brings different data tools under one roof. This makes it simple for teams to find and use the information they need. AI integration takes this further by adding a layer of intelligence to everything. This means anyone can create professional Power BI reports without requiring special training or experience.
But what does the road ahead look like? These capabilities show where data modeling for Power BI is headed.
I. Improved Predictive Analytics Capabilities
Fabric connects with Azure Machine Learning for advanced predictive modeling. Instead of only seeing what happened yesterday, teams can forecast future trends. They can build machine learning workflows and train models right where their data lives. There is no need to move files or rebuild complex pipelines.
For example, when a new customer signs up, the system can instantly predict their future needs as the records are saved. Reports always include the latest predictions without requiring extra manual work.
II. Self-Learning Data Models
In the future, we might see “Operations Agents” that act as smart assistants. These systems reason, learn, and react in real time. They also detect risks as they happen. To give an example, if an agent notices a sudden dip in supply chain speed, it can intervene before it affects customers.
Because everything runs on the same data model, these smart actions happen across the entire company rather than in disconnected pockets. This moves an organization from reacting to problems to preventing them.
III. Natural Language Data Modeling
Copilot offers a more advanced way to query data using natural language. It makes Power BI smarter at understanding what users mean. So, if someone asks for “yearly gains,” it knows they mean “annual profit” by checking related terms in Office and Bing.
And as users type a question, the system gives them instant suggestions and results. It even picks the right charts for them. For example, if someone asks for sales by region, it automatically places the “Sales” and “Region” data on the correct axes of a map or bar chart.
IV. Cross-Platform Intelligence Integration
Fabric IQ becomes even more powerful when combined with Foundry IQ in Microsoft Foundry and Work IQ in Microsoft 365. This creates a shared intelligence layer that connects business data, documents, emails, and company knowledge. These capabilities turn Fabric from just a place to store data into a platform that understands your whole business. This unified system ensures that an insight found in a Power BI report can be instantly connected to a relevant project document or a team discussion.
Looking ahead, Power BI will keep getting smarter. Its integration with Fabric and AI will allow it to understand what kind of information users need before they even ask for it. It will handle boring tasks on its own, so that users can focus on more important work. This means companies will save time and make fewer mistakes when dealing with their data.
| Dimension | Current State | Future with Fabric + AI |
|---|---|---|
|
Time-to-Insight |
Hours or days |
Few Minutes |
|
Model Scalability |
Dataset-level |
Enterprise-level |
|
Decision Accuracy |
Subject to human skill |
Powered by AI-driven recommendations |
|
Data Governance |
Workspace-specific |
Enterprise-wide unified governance |
|
Collaboration |
Limited to BI teams |
Cross-functional (Data engineers + Analysts + Business) |
Summing Up
The struggles of legacy data modeling are fading away with the integration of Power BI with Microsoft Fabric and AI . AI can spot mistakes, suggest better ways to organize data, and even handle boring tasks for us. Microsoft Fabric acts like a bridge that connects everything smoothly. As these tools get better, working with data will become something anyone can do, not just experts.
Organizations that aim to embrace these technologies should establish clear goals and strong governance frameworks. But integrating Fabric and AI also requires careful planning and specialized knowledge. A reliable Power BI consultant makes sure your teams get the most from these capabilities. They can help you implement Power BI data modeling practices and build models that scale easily with your business needs.
FAQs
Microsoft Fabric acts as a single space for all your data tools. Instead of switching between different platforms, teams can find, manage, and analyze information in one place. It removes the technical silos that usually separate data storage from reporting. This approach makes it much simpler for everyone to collaborate, ensuring that the entire organization works from the same accurate set of facts.
Even with advanced tools, the foundation of your reports must be solid to avoid errors. Professional Power BI data modeling services help you structure complex data sets, so they run fast and stay accurate. Experts ensure your "data backbone" is built correctly from the start, eliminating the time wasted on manual cleanup. All this allows your team to focus on making better business decisions.
AI works like an intelligent assistant that takes care of tricky parts of data management. It reviews your data to find hidden relationships between datasets, corrects formatting problems, and points out important patterns. By doing all this work, AI reduces the chances of errors. It makes sure the insights displayed in your Power BI dashboards come from data that is clean, trustworthy, and well-analyzed.
Natural Language Processing, through tools like Copilot, lets you talk to your data using everyday language. You do not need to learn complex code or drag-and-drop fields. You can simply ask questions like, "Which product had the best growth last month?" The system figures out what you mean, gathers the right data, and creates the chart for you. This makes advanced analytics available to anyone in your company.


