With the rising competition from eCommerce and mCommerce platforms, the retail industry is reeling under the relentless pressure to hold on to its customers, meet sales targets, and improve brand presence. To thrive in this competitive business landscape, retailers need to structure, visualize, and manage large volumes of business and customer data to meet ever-changing needs and expectations and provide an exceptional customer experience.
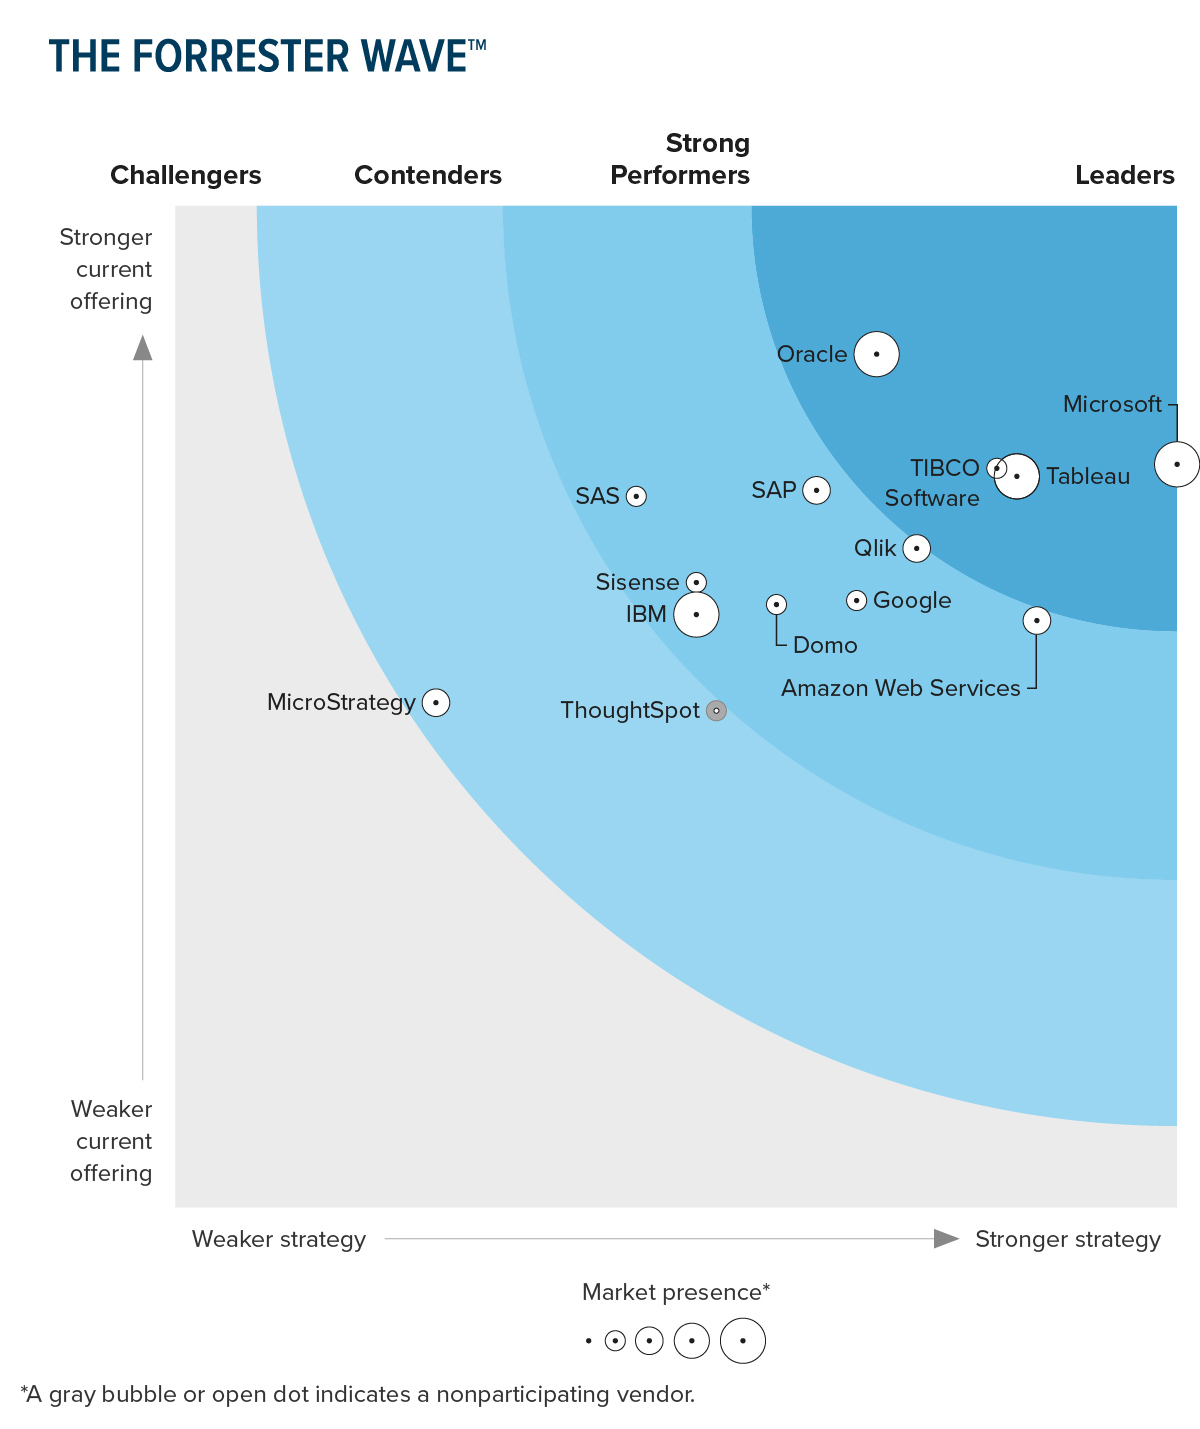
This is where the need for Power BI comes in. Using this data visualization software powered by Microsoft, retailers can not only tap into their customer data but also adapt quickly to market shifts, spot hidden patterns and trends, build customer loyalty, and seize new opportunities, steering retail businesses to new heights of growth and success. This may be the reason why Microsoft has been recognized as a Leader in The Forrester Wave™: Augmented BI Platforms, Q2 2023.
How Power BI Brings a Strategic Paradigm Shift in the Retail Landscape
The retail industry is churning large volumes of data from customer’s buying patterns to supplier data, inventory details, employee information, and more. Every data point presents an opportunity for retailers to deliver exceptional value to customers and make their business more successful and competent.
At the pinnacle of this data-driven revolution stands Power BI, an interactive data visualization tool that not only records these data points but also transmutes them into a visual language that empowers retailers with a holistic view of their retail processes and helps them uncover insights for improving customer engagement, inventory management, store performance, product merchandising, and more. In other words, this data visualization software can be a strategic growth enabler for retailers striving to deliver delightful customer experiences, achieve higher sales, and cut down on costs related to customer acquisition and operations. Read on to discover how Power BI data visualization is bringing a much-needed shift in the retail space.
1. Enhanced Shopping Experience
Power BI in the retail sector can do wonders by analyzing how customers interact with the products. For instance, customers can receive personalized product suggestions based on their buying behaviors and purchasing history and this is just one way this data visualization tool can transform the shopping experience and take it to the next level.
2. Predictive Analytics
Predicting inventory is another key area in retail where Power BI dominates over other data visualization software. Using this tool, retailers can accurately predict stock shortages and replenish their inventory on time. The predictive analytics capability empowers retailers to make informed decisions, leading to improved efficiency and reduced costs.
3. Consistency Across Multiple Touchpoints
The key to thriving in the competitive retail landscape is providing a uniform shopping experience across multiple channels. This data visualization software provides operational and customer data when integrated across all touchpoints allowing retailers to create a consistent shopping experience, which in turn, helps them build customer loyalty and trust.
4. Real-time Decision-Making
Having access to real-time data offers the agility retailers need to make informed decisions and stay competitive. With Power BI, retailers can quickly analyze data, which in turn, allows them to quickly adapt to changing customer preferences, market fluctuations, and emerging trends.
Democratize Data With Power BI for Informed Decision-making
Maximizing Retail Potential: The Brilliance of Power BI
Power BI as a service has become a coveted choice among retailers to collect, curate, and generate meaningful insights from raw and unstructured data. It offers a host of benefits that redefine the way retail businesses operate, strategize, and thrive. Listed below are the key benefits of using this data visualization software in the retail sector.
1. Improved Inventory Management
Retail businesses are likely to encounter an array of inventory challenges ranging from overstocking issues to inefficient tracking. The good news is that retailers can overcome most of the stock-related challenges by using this data visualization software. The analytical capabilities of this tool allow retailers to optimize inventory management by identifying slow-moving or overstocked items, analyzing sales trends, and predicting future demand. This helps them reduce inventory costs, ensure optimal stock levels, and improve order management and processing.
2. Customer Insights and Segmentation
Using the advanced analytics capabilities of this data visualization software, retailers can not only gain insights into customer behavior but also segment them based on their preferences, demographics, and purchasing history. This allows retailers to enhance marketing initiatives and boost customer experience. Furthermore, customer insights and segmentation allow retailers to craft personalized offers and data-driven marketing campaigns resulting in increased revenue and profitability.
3. Competitive Advantage
By leveraging the capabilities of Power BI, retailers can make informed and data-driven decisions. This enables them to swiftly adapt to changing market dynamics, enhance customer experiences, optimize operations, and stay ahead in the dynamic and fiercely competitive landscape of retail.
Real World Use-cases of Power BI in Retail
Power BI has emerged as a game changer in the retail sector since it allows retailers to improve operational efficiency, optimize customer experiences, and make data-driven decisions for accurately predicting future demand. Listed below are some real-world examples of Power BI in retail:
I. Supply Chain Visibility
A leading multinational retail corporation based out of Denver leveraged the potential of this data visualization software to gain visibility into its complex supply chain operation. The tool enabled real-time monitoring of inventory levels, transportation, and suppliers. By improving the visibility across the supply chain process, the retailer enhanced overall operational productivity and improved supply chain efficiency.
II. Store Performance Optimization
A US-based supermarket chain employed this data visualization tool to monitor and analyze store performance metrics, including in-store visits, average transaction values, and conversion rates. By comparing these metrics across different store locations, the retailer identified stores that are performing well and implemented the same strategies in underperforming ones to replicate success, resulting in increased sales and profitability.
Summing Up
Embracing a data visualization tool is not just an option but a strategic imperative for retailers to unlock patterns, trends, and opportunities hidden in raw and unstructured data. If you want to respond quickly to market shifts and consumer demands to gain a competitive advantage, you may consider seeking end-to-end consultation from a reliable partner that has rich prowess in implementing BI and Data Visualization software.


