

They say understanding the needs of your customers first is essential. No matter which industry you belong to, understanding customer journeys has always been a common challenge. And now, with so much happening around, it has become even more critical (and more complex) than ever before. Legacy customer journey mapping models are becoming obsolete as they cannot keep pace with the huge volume of customer data that companies deal with nowadays. Businesses, small or big, now need real-time insights to deliver personalized experiences that customers always want. Yet, many find themselves trapped with siloed data systems that often fail to capture the dynamic nature of modern customer interactions.

As per a Salesforce study, 73% of customers expect companies to understand their needs and preferences. How? The answer is Salesforce data graphs. While it may not be the front-end/customer-facing solution that you were expecting, it’s definitely the immediate solution to transform enterprise data and visualize customer journeys.
In this blog, we’ll cover everything that you need to know about data graphs built on Salesforce—why you need them, what they are exactly, use cases, and how they’re so impactful.
Table of Contents
What’s Wrong with Traditional Customer Journey Mapping Tools?
How Salesforce Data Graphs Provide a Comprehensive View of Customer Journeys?
How to Create and Manage Data Graphs in Salesforce Data Cloud?
What’s Wrong with Traditional Customer Journey Mapping Tools?
Legacy customer journey mapping tools were designed for simpler times… one where customer touchpoints were limited, data sources were manageable, and customer expectations were more predictable. Now, the scenario is totally different, exposing the limitations of conventional tools.
1. Siloed Data Architecture
Most traditional journey mapping tools operate in silos, meaning disconnected views of customer interactions. The lack of consolidated data from multiple sources like CRM, marketing platforms, social media, etc., results in fragmented customer profiles that might overlook key behavior patterns and insights.
2. Limited Capabilities
Some legacy tools rely on batch processing and past data analysis, which might not work anymore in the current situation. The gap between customer actions and business responses opens a big window of opportunities. Companies wouldn’t want to miss out on the scope of providing real-time personalization.
3. Scalability Challenges
As organizations grow, their customer data continues to mount over time. Unfortunately, traditional tools cannot keep up with that. Furthermore, multiple API calls, complex data joins, and resource-intensive processing create bottlenecks that limit scalability and often increase infrastructure costs.
Why the Need for Data Graphs?
The limitations discussed above have created a pressing need for a more sophisticated approach, one that can handle the complexity and volume of modern customer data while giving access to real-time insights. Data graphs address these challenges by creating integrated, relationship-based representations of customer data that can be queried and analyzed in real time. This capability is of the utmost importance to decision makers.
Plus, you cannot deny the predicted growth of the global customer journey analytics market.
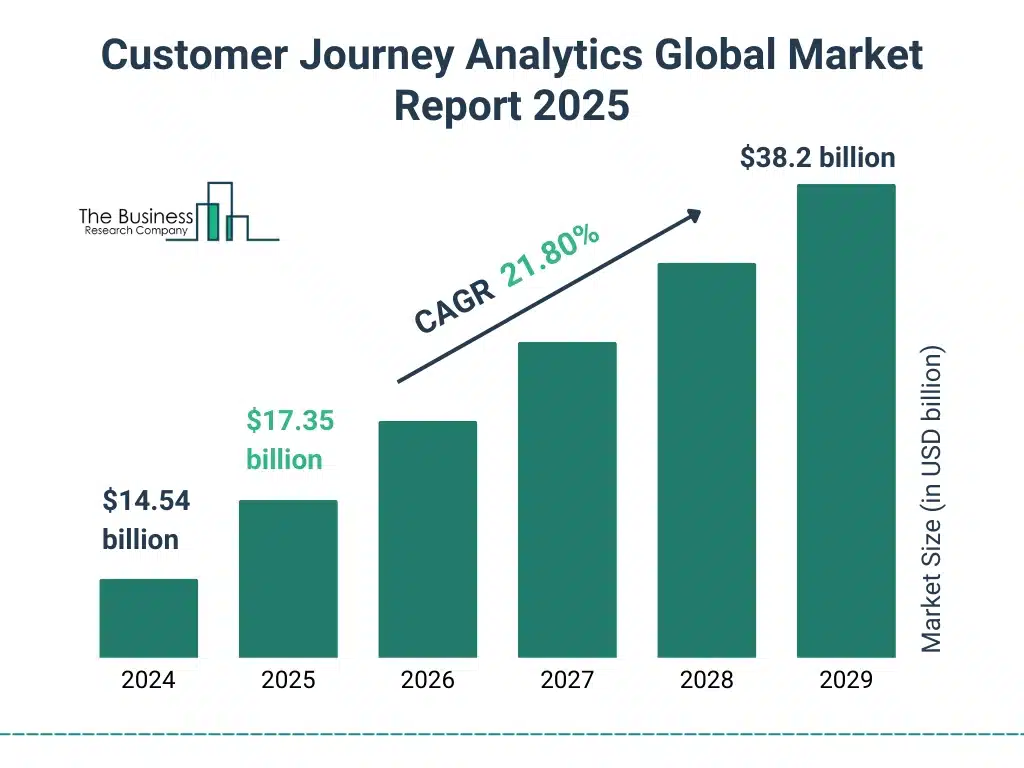
It shows that enterprises are chasing the right set of tools and technologies to get to know their customers in and out.
What Are Data Graphs Exactly?
Data graphs are nothing but essentially data structures. They highlight two primary aspects in a graph-based format: customer data, and their relationship with your company.
At its core, a data graph consists of nodes (entities) and edges (relationships) that create a network of interconnected data points. Here’s what they represent:
Nodes = Different aspects of customer data (individual customers, products, transactions, or interactions)
Edges = Relationships between these entities
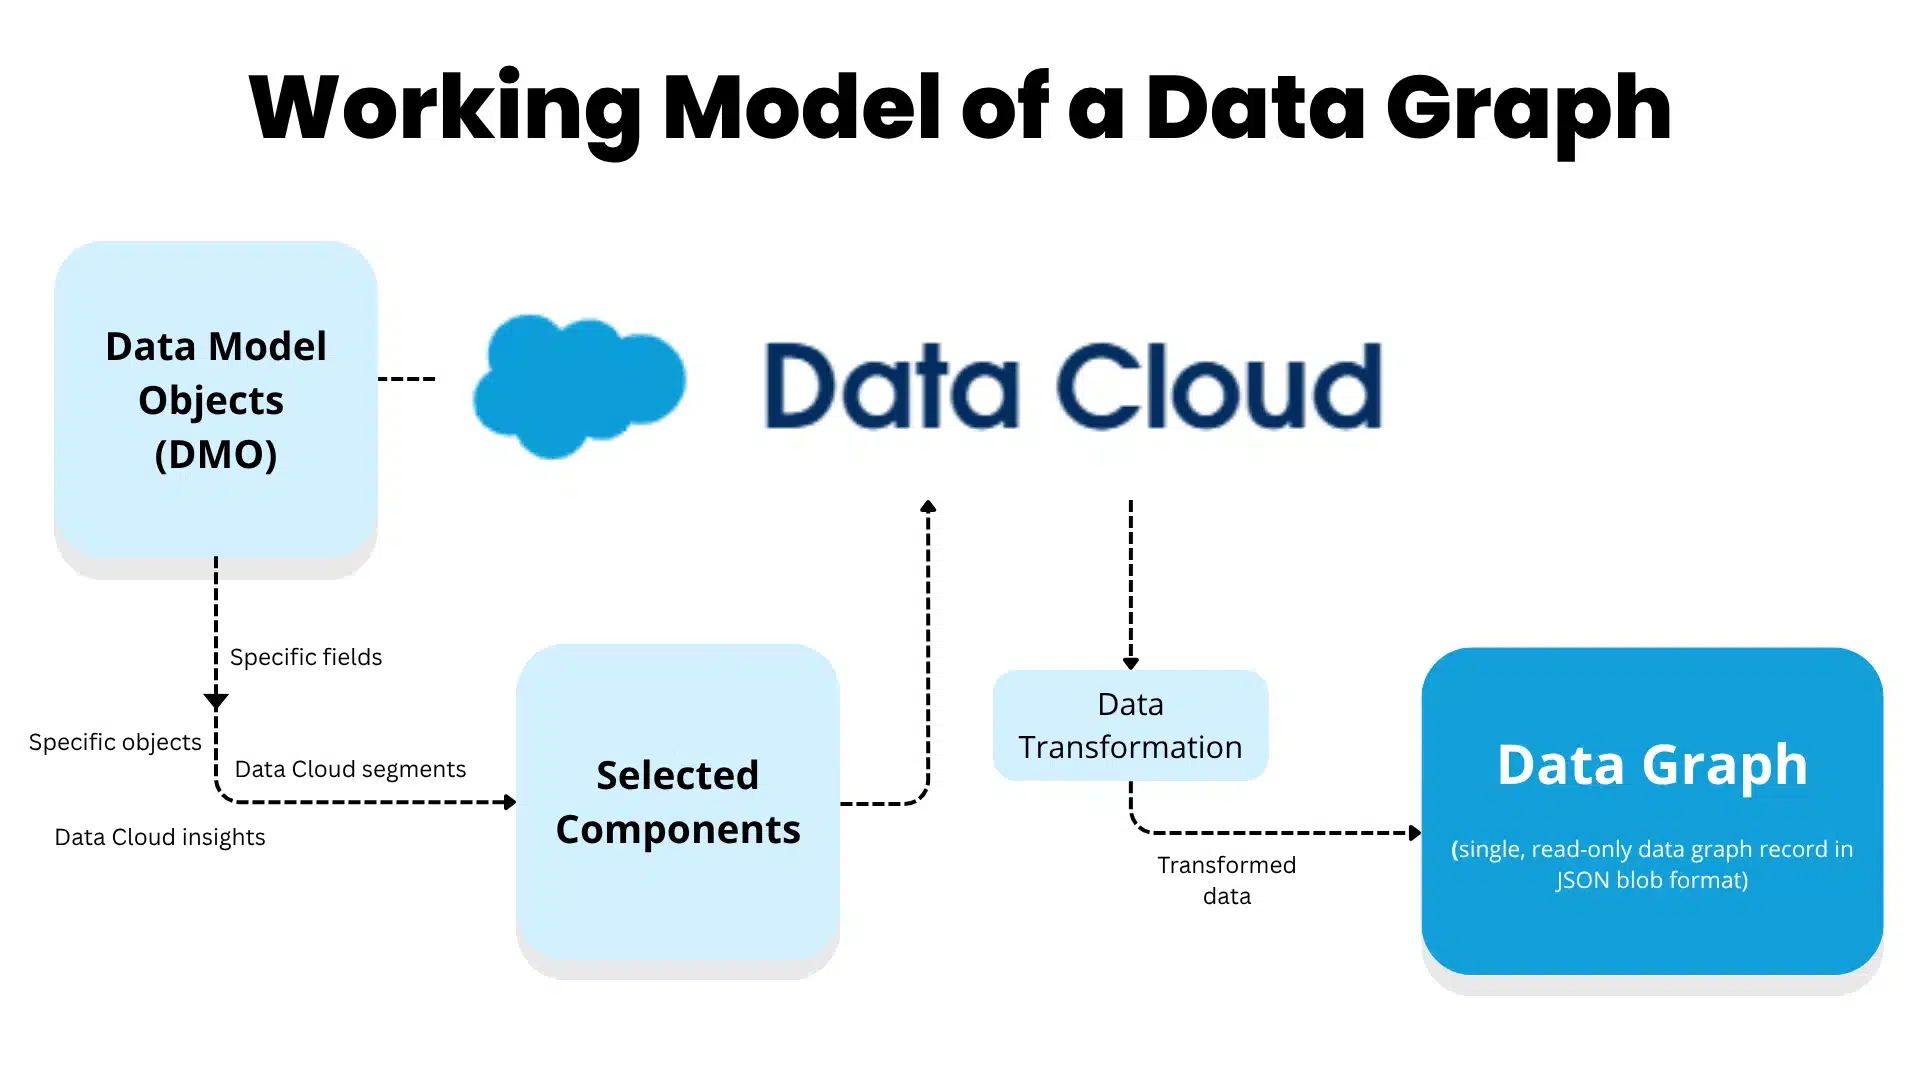
Data graphs are generally stored as JSON blobs. This makes them highly portable and easy to integrate with various apps. This JSON format also allows for flexible data structure and rapid retrieval, essential for real-time customer journey applications. For example, here’s how a data graph is generated in Salesforce.
Instead of computing customer data on-demand, data graphs precompute and store commonly accessed views of customer information. This precomputation reduces query response times and system load, enabling data retrieval in seconds even for the most complicated customer profiles.
Additionally, data graphs offer flexibility in data structure, leaving room for change in customer data without requiring extensive database modifications. This flexibility gives enterprises the license to bring in more data points/sources and customer touchpoints without hitting roadblocks.
How Salesforce Data Graphs Provide a Comprehensive View of Customer Journeys?
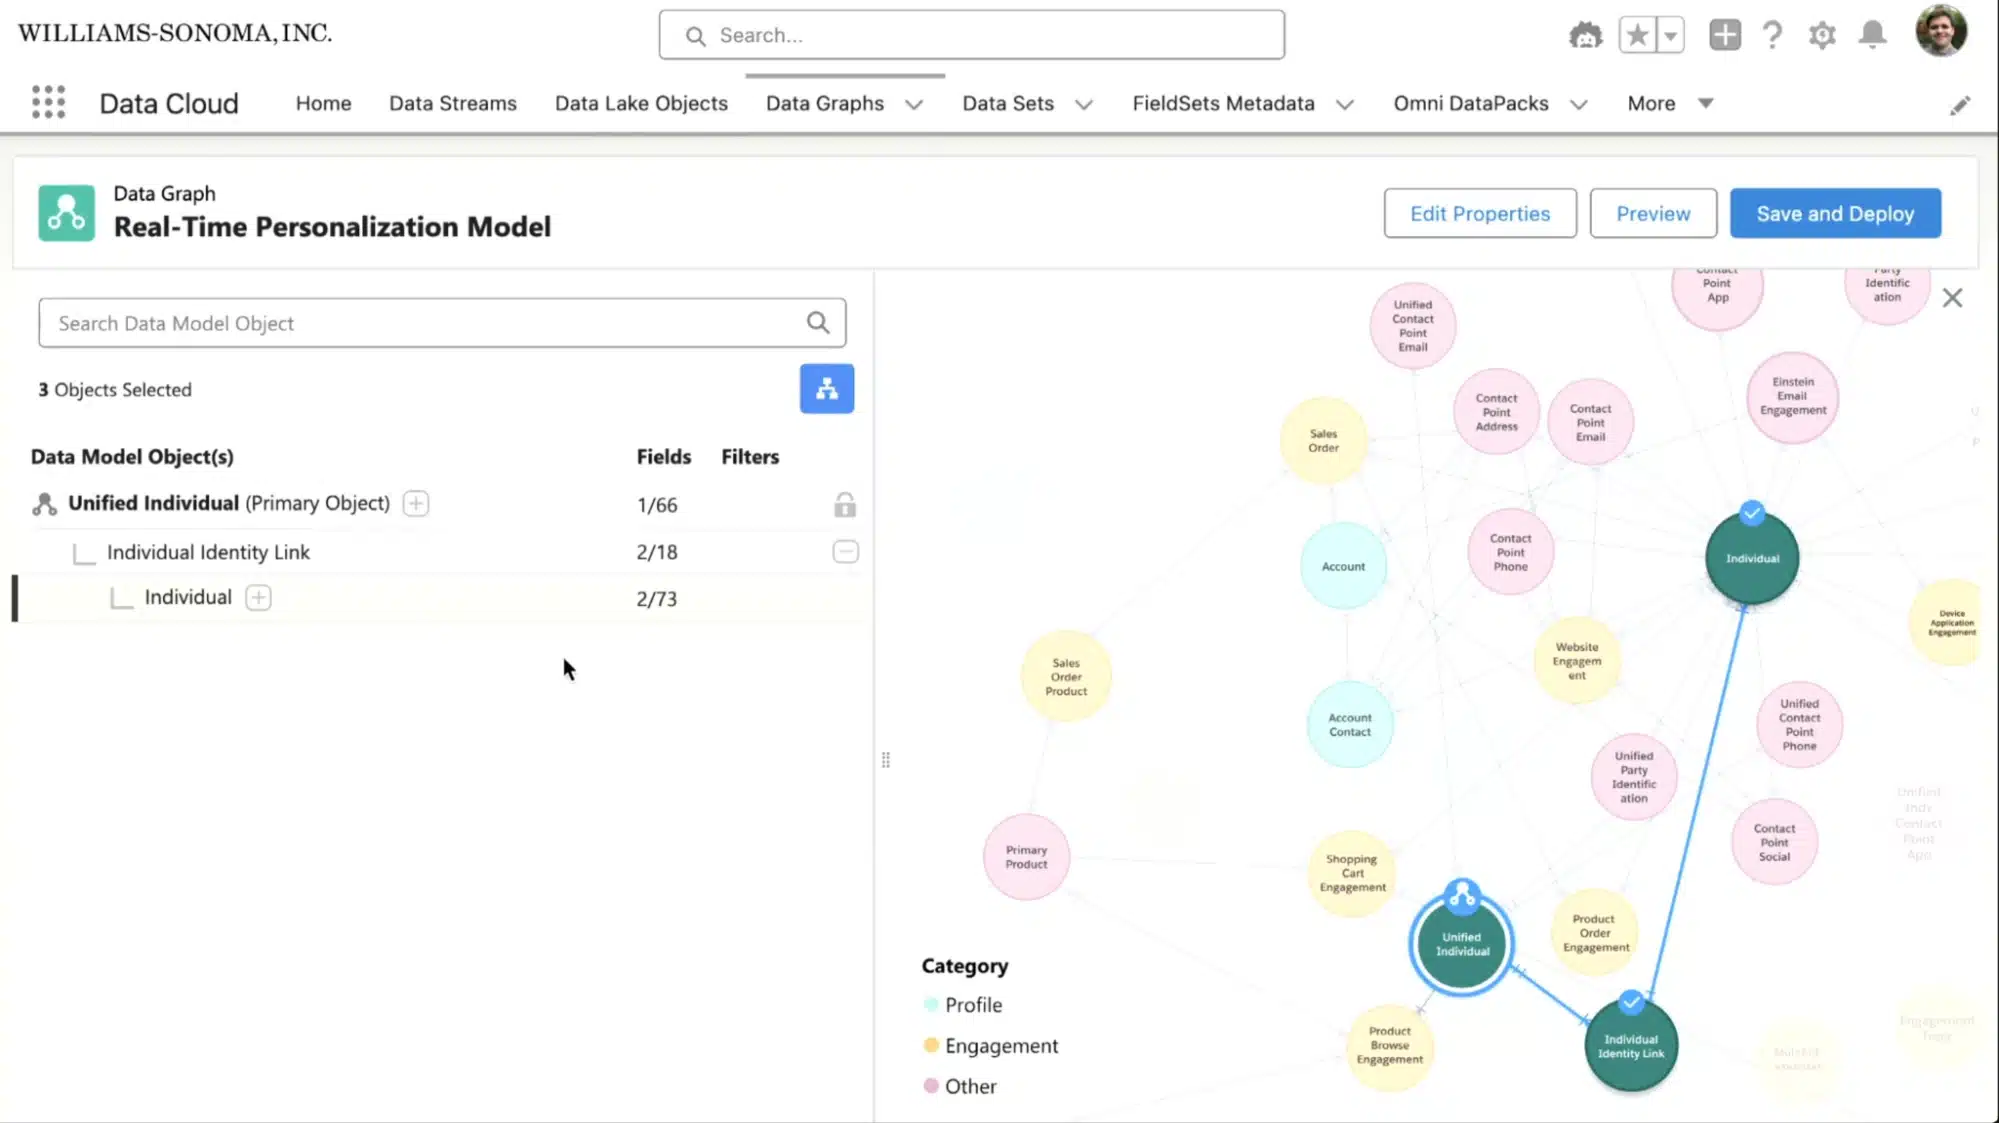
Salesforce-powered Data Graphs can be accessed through the Data Cloud. Unlike traditional approaches that store data in separate tables and systems, these data graphs create a unified, interconnected web of customer information with close-to-accurate customer journeys.
Here are a few things that make Salesforce data graphs one of a kind:
I. Unified Customer Profiles from Data Across Channels
Data graphs consolidate customer information from multiple Data Model Objects (DMOs). Hence, they create comprehensive customer profiles that include purchase history, engagement data, support interactions, social media activity, and behavioral patterns. Furthermore, data graphs allow you to track customer journeys across multiple channels and touchpoints seamlessly, i.e., through web, mobile, social media, or in-store channels.
II. Real-Time Data Sync & Journey Visualization
Through continuous data ingestion and processing, data graphs maintain up-to-date customer profiles that reflect the latest interactions across all touchpoints. This capability ensures that customer journey insights are always current and accurate. In fact, as customers interact with different touchpoints, the graph automatically updates to reflect new pathways, preferences, and patterns, providing a live representation of customer journeys.
III. Relationship-Based Data Structure
Data graphs map the relationships between different data points, creating a network of interconnected information. This relationship-based approach brings out hidden patterns and insights that traditional flat-file systems cannot detect.
Why Do Enterprises Prefer Using Salesforce Data Graphs?
Salesforce data graphs bring a handful of benefits that shadow the limitations of traditional customer journey mapping approaches.
- Enhanced Performance and Speed: Data graphs help you accelerate response times, even with large datasets. By precomputing and storing customer views as JSON blobs, organizations can access comprehensive customer profiles instantly, enabling quick personalization and decision-making.
- Reduced Infrastructure Costs: Data graphs reduce the number of API calls required to access customer information. No longer making multiple calls to different systems/apps. You can simply access customer data through a single query, drastically reducing infrastructure costs.
- Improved Data Accessibility: By providing a unified interface to customer information, data graphs simplify access to crucial data. Teams across marketing, sales, and service can access the same comprehensive customer view which ensures consistency and eliminates any data discrepancies.
- Enhanced Personalization Capabilities: With real-time access to comprehensive customer profiles, you can deliver highly personalized experiences at scale. Data graphs enable marketers to leverage complete customer histories, preferences, and behaviors to create targeted campaigns and personalized interactions.
- Better Decision-Making: The unified view provided by data graphs enables more informed decision-making across all customer-facing functions. Teams are able to access complete customer context, leading to more effective strategies and better business outcomes.
Connect Your Data, Empower Your Decisions
How to Create and Manage Data Graphs in Salesforce Data Cloud?
The process of creating and managing data graphs in Salesforce Data Cloud is mostly straightforward. Below are the steps you might want to follow for creating data graphs.
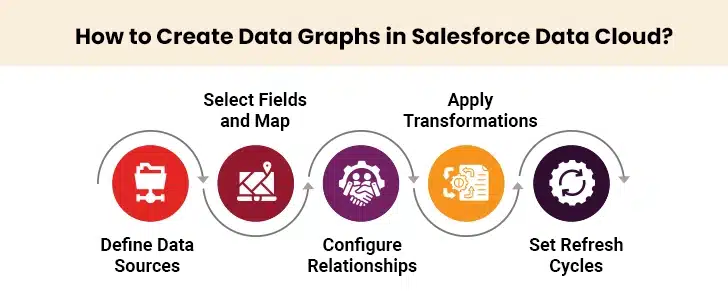
Step 1: Define Data Sources
Identify and select the primary and related Data Model Objects (DMOs) that will contribute to your data graph. This might include customer profiles, engagement history, transaction records, support interactions, and behavioral data from various touchpoints.
Step 2: Select Fields and Map
Once data sources are identified, you need to select the specific fields from each DMO. This underlines the fact that only relevant datasets are considered, which means more optimized performance and storage efficiency.
Step 3: Configure Relationships
Define the relationships between your different data entities. For example, specify how customer records connect to your transaction data or how engagement metrics relate to your customer profiles, etc. Basically, you need to tell the system how all touchpoints relate to each other.
Step 4: Apply Transformations
Apply data transformation techniques to build your data graphs. Group your data by region, calculate average spending over time, or aggregate engagement metrics. By using these transformations, you’ll be able to create meaningful insights directly within the graph structure.
Step 5: Set Refresh Cycles
Set up data graph refresh cycles based on your business needs. Choose from daily, weekly, or monthly updates. In some cases where apps are time-sensitive, you get the option of hourly updates. Balance data freshness with system performance.
Step 6: Query Data Graphs
Once ready, use Salesforce Metadata API and Query API (or Graph QL) to visualize data using data graphs. The JSON-based format seamlessly integrates with both Salesforce applications and third-party systems, making the data graphs that you generate a multi-purpose asset for various use cases.
Management and Optimization
For getting the best results from your data graphs, consider monitoring performance metrics on a regular basis and then adjusting refresh cycles based on usage patterns. Also, optimize data structures for better efficiency. The best thing is that Salesforce already provides tools and analytics out-of-the-box to help organizations maximize the value of their data graphs.
How to Take Control of Your Marketing Data in Salesforce
Top 3 Applications of Salesforce Data Graphs
Salesforce data graphs have numerous applications across, but here are three of them that particularly stand out w.r.t. customer journey mapping.
1. Real-Time Identity Resolution and Customer Unification
Data graphs are used to create unified customer profiles from disparate data sources. When you bring all your customer interactions across channels, devices, and touchpoints under one roof, your team can resolve customer identities in real time and maintain consistent customer experiences.
It’s important to note here that Salesforce data graphs run on advanced algorithms that connect seemingly unrelated interactions to the same customer. This forms the basis of all your other customer journey mapping activities.
2. Hyper-Personalized Customer Engagement
Data graphs allow marketing teams to leverage real-time customer insights for hyper-personalized campaigns. By accessing complete customer profiles that include purchase history, engagement patterns, preferences, and behavioral data, marketers can create highly personalized experiences that resonate with individual customers.
The built-in real-time feature of data graphs means that personalization can adapt to customer behavior as it happens. This makes way for dynamic content delivery, personalized product recommendations, and on-time interventions that are bound to drive engagement and conversions.
3. Optimized Customer Service and Support
Customer service teams might use data graphs to access comprehensive customer information instantly. Instead of searching through multiple apps to understand customer history, customer reps can view complete customer profiles that include past interactions, purchase history, preferences, and current issues.
This comprehensive view enables service teams to provide contextual, personalized support that addresses customer needs more effectively. Consequently, it leads to improved customer satisfaction, reduced resolution times, and enhanced customer loyalty.
That’s a Wrap
Salesforce data graphs now completely change how organizations approach customer journey mapping, moving more towards dynamic, unified customer intelligence. The benefits go beyond adaptive personalization, operational intelligence, and improved decision-making. As the customer journey analytics market continues to grow and customer expectations continue to expand, data graphs provide the technological foundation necessary to compete in a data-driven landscape. Without any doubt, enterprises using Salesforce data graphs will see better customer satisfaction in the next few years. Consulting a Salesforce expert is one way to get started with data graphs.
Enterprises that successfully implement this technology will be better positioned to deliver hyper-personalized experiences that customers have always been after.