Have you ever stared at a spreadsheet full of numbers and felt completely lost? You are not alone in this struggle. Most analysts’ brains aren’t wired to interpret large tables of data. But what if you could transform confusing data into compelling stories using data visualization tools? The most successful analysts have discovered that turning numbers into compelling narratives drives immediate action. Instead of overwhelming stakeholders with spreadsheets, they can choose the right charts that tell clear stories. In this article, we’ll walk you through the best practices for creating data visuals that actually work, using real examples from different industries that prove how powerful this approach can be.
This is just one instance where lives are at risk. All this traces back to inaccurate labels in the training datasets. Other than accuracy, there are multiple other data labeling challenges that prevent companies from harnessing the full potential of AI and ML models. Given this scenario, it is not at all shocking that a staggering 74% of companies struggle to achieve value and scale their AI initiatives.
Data labeling is an intricate process that transforms raw data into meaningful insights that power your AI and ML systems. Whether you’re developing computer vision apps, NLP models, or predictive analytics software, it is the accuracy and quality of the labeling process that determines their success. However, as easy as it may sound, data labeling is laced with challenges.
As companies bet their future on AI to drive business decisions, enhance customer experiences, and automate complex processes, data labeling becomes important. One mislabeled dataset can translate into biased algorithms and poor model performance. Even worse, it damages the business reputation as well. The stakes couldn’t be higher. That said, let’s start with the basics first and understand why data labeling is important for AI and ML Success.
Table of Contents
What Are Data Visualization Best Practices for Analysts?
What Are Data Visualization Best Practices for Analysts?
Data visualization best practices help analysts present data in a clear and concise manner. Given below are the best practices that educate analysts on how to present information clearly, making charts and graphs that tell stories instead of just showing data.
I. Know Your Audience
Getting to know the audience makes all the difference in data visualization. Business leaders want quick insights to make decisions. Team members might need more details to understand how things work. The audience shapes everything from colors and fonts to chart types and complexity levels. Smart analysts know how to make charts more useful. When a chart connects with its viewers, it helps people understand the message better. The secret lies in creating visuals that speak directly of what matters most to the audience viewing them.
II. Choose the Right Chart Type
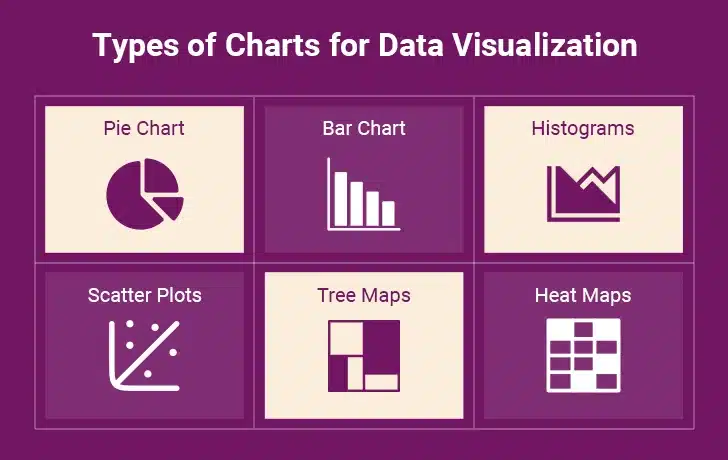
Picking the wrong chart can make great data look confusing and hard to follow. Each chart type has its own job to do. Line charts work best for showing how things change over time, like sales going up and down throughout the year. Bar charts shine when comparing different groups, like which department performed best. Scatter plots help spot connections between two things, like whether more advertising actually leads to more sales. Getting the chart type right makes data tell its story clearly. When the choice fits, people understand immediately. When it doesn’t, meetings get stuck on explanations instead of insights.
III. Tell a Compelling Data Narrative
Without a story, data is just numbers sitting on a canvas. Start with your main point and then show the data that supports your story. Put your charts in a narrative style, like beginning, middle, and end. Charts should build the story piece by piece, leading viewers through the information logically. Use titles that explain what people should notice. Don’t let your audience guess what the data means. When you tell a good story with data, people remember it better and are likely to act on the insights learned.
“The best analytics teams don’t just report numbers; they tell stories that change behavior.” – Carl Anderson, Director of Analytics, Warby Parker.
IV. Incorporate Emerging Trends and Technologies
New trends can make your charts more useful. For instance, immersive dashboards let people explore data independently. Charts that work on mobile devices reach more people. However, don’t use any new trend just because it’s popular. Only use it if it helps people understand the data better. Sometimes, simple charts work better than fancy ones. Focus on what helps your audience the most.
V. Ensure Data Integrity
Your charts are only as good as the data behind them. Always check your data points before making charts. Make sure your data comes from trusted sources. If there are gaps in the data, addressing them upfront shows professionalism. People respect honesty and trust future work more when analysts acknowledge limitations. Clean, accurate data forms the groundwork for everything else. Without it, even the most beautiful visualization becomes worthless.
“Data is only as valuable as the decisions it drives. Visualization bridges the gap between insight and action.” – Cassie Kozyrkov, Former Chief Decision Scientist, Google.
VI. Avoid Common Mistakes
Many analysts make the same mistakes when creating visualizations. For instance, using too many colors makes charts confusing. Starting scales at the wrong place can make small differences look huge. Three-dimensional effects often make data harder to read. Putting too much information on one chart overwhelms people. Choosing the wrong chart type for your data confuses your audience. Learning about these common problems helps you avoid them and create better charts that people trust and understand.
VII. Use the Right Tools and Platforms
Different projects need different visualization tools. Simple tools like Excel work well for basic charts. More advanced tools like Tableau help create complex charts with lots of features. Free tools like Google Charts work for web projects. Choose tools based on what needs to be done, not what sounds most impressive. The right tool makes your job easier and your results better. Sometimes, the simplest solution delivers the most value.
Exploring the Best Tools for Data Visualization
| Tool Name | Key Features | Best For |
|---|---|---|
| Tableau | 1. Drag-and-drop interface 2. Interactive dashboards 3. Strong community support 4. Cloud & desktop versions | I. Business analysts II. Enterprise reporting III. Interactive visual storytelling |
| Power BI | 1. Microsoft integration 2. DAX formulas 3. AI-driven insights 4. Cost-effective for Office 365 users | I. Corporate dashboards II. Real-time analytics III. Microsoft ecosystem users |
| Python (Matplotlib/Seaborn) | 1. Highly customizable 2. Open-source 3. Integrates with Pandas/NumPy 4. Supports complex statistical plots | I. Data scientists II. Researchers III. Custom/advanced visualizations |
| R (ggplot2) | 1. Statistical focus 2. Publication-quality plots 3. Reproducible research 4. Grammar-of-graphics approach | I. Statistical analysis II. Academic research III. Detailed exploratory data analysis (EDA) |
| Looker Studio (Google) | 1. Cloud-based 2. Seamless Google integration 3. Easy sharing/collaboration | I. Quick reports, marketers II. Teams requiring lightweight & shareable dashboards |
| Qlik Sense | 1. Associative data model 2. AI-assisted insights 3. Strong scalability | I. Large-scale BI II. Associative analytics III. Self-service business intelligence |
VIII. Testing and Iteration
Your first chart is rarely your best chart. Show your work to other people and ask what they think. Watch how they react when they first see your charts. Do they understand the main message quickly? Are they confused by anything? Use their feedback to make iterations. Taking feedback professionally and using it constructively leads to visualizations that truly serve the purpose. Good visualization involves constant improvement: creating something, testing it, and making it better.
Key Steps in the Refinement Process:
- Gather feedback from sample audience members
- Test readability on various display types
- Measure how quickly viewers grasp key points
- Identify and remove remaining distractions
- Confirm all data representations are accurate
- Document changes made during revisions
Powering the Future of Insights in the Age of Autonomous Intelligence
What Are the Real-World Examples of Data Visualization?
Data visualization helps make sense of numbers in real life. Given below are some real-life examples showcasing how businesses use charts and graphs to explain complex information simply, from sales trends to health statistics, anyone can understand.
1. Sales Performance Tracking
Sales teams use colorful charts to show their monthly sales. These visual reports reveal which salespeople excel and which ones need support to boost their results. Managers can spot at a glance which products are popular and which one’s customers no longer want. The charts also highlight the peak sales seasons, helping teams get ready for busy periods. When sales figures are represented in graphs, patterns emerge that might go unnoticed in standard reports. This clear picture of sales performance allows companies to make wise choices about hiring, training, and product planning.
2. Customer Behavior Analysis
Companies analyze customer shopping habits and behavior by converting their actions into simple charts and maps. These charts highlight which items customers view most and which ones they purchase. Website owners can identify where visitors click frequently and use this data to better target customers. Retail stores can discover which sections customers visit often and position popular products there to boost sales. The data also shows peak shopping hours, helping businesses schedule their employees. This thorough grasp of customer behavior allows businesses to create improved experiences that encourage people to return and spend more money.
3. Financial Performance Monitoring
Companies rely on charts to monitor their daily cash flow. These financial visuals help managers see if the company is profitable or losing money. Budget teams can identify areas of overspending and discover ways to cut costs without damaging operations. The charts also highlight which divisions generate the most revenue and which ones require additional focus. Financial institutions and potential investors examine these charts to determine whether to provide funding to the enterprise. Accounting departments also use these charts to break down complex financial data. This clear picture of financial health helps companies maintain stability and experience steady growth over time.
4. Manufacturing Performance Analysis
Factories rely on visual dashboards to keep an eye on machine performance and avert costly breakdowns. Production managers monitor charts of output levels to make sure they meet customer orders on time. Quality teams look at charts of defect rates to keep products up to standard and customers happy. Supply chain heads use chart reports to line up raw material arrivals with production plans. Factory leads assess the worker output and safety issues through easy-to-read charts that help create safer workplaces. Furthermore, energy consumption graphs show which machines use too much power and require fixing or replacing. Lastly, visual production plans highlight which orders are late and need immediate focus to meet deadlines. These visual tools help manufacturing companies cut costs, boost product quality, and ship goods faster to their customers.
5. Transportation Efficiency Monitoring
Transport firms use visual tracking to move people and goods well while cutting fuel costs a lot. Airlines make flight boards showing delays and cancellations to fix schedules and keep flyers in the loop about changes. Shipping firms use cargo maps to monitor package locations and make sure deliveries get there right on time. Public transit systems count on rider flow charts to tweak schedules and cut down on crowds during busy times. Truck companies track fuel usage to spot drivers who waste gas and give them more training. Delivery services make route charts that help drivers find the quickest ways to save time and gas money. These data and information visualizations help transportation firms save cash, make customers happier, and reduce their impact on nature through better planning.
6. Improved Patient Care
Hospitals and clinics use visual data to provide better patient care. Emergency room dashboards show patient flow and help reduce waiting times when people need quick medical help. Doctors look at the charts of the vital signs of a patient to spot health issues before they turn into big problems. Nurses depend on visual medicine schedules to give patients the right treatments at the right time. Hospital managers look at expense graphs to find ways to save money without hurting patient care quality. Public health officials make disease outbreak maps to act fast and stop illnesses from spreading to more people. Medical researchers use visual data to follow treatment results and find new cures faster than before. These data analytics and visualizations help healthcare workers give quality care while lowering costs.
Drive Business Impact with Damco’s Expertise
Now that you know the best practices for creating effective data visuals, it’s time to put them into practice. Don’t wait for the fanciest tools. Begin with whatever you have right now. Look for opportunities in your existing workflows where you can turn numbers into simple charts. Maybe it’s tracking your monthly expenses or helping a local business understand its customer patterns.
Remember what worked well in the examples we discussed – hospitals improved patient care, stores increased sales, and factories prevented costly breakdowns. All these successes started with someone deciding to make data easier to understand. Pay attention to what makes a chart helpful. Keep the colors simple, titles clear, and message focused. Ask people to look at your visuals and tell you what they see. Their feedback will teach you more than any textbook ever could. Most importantly, don’t get discouraged if your first attempts aren’t perfect. Every expert started exactly where you are now. If you need expert help to turn data complexity into clarity, you may partner with a trusted data analytics and visualization company like Damco.


