

Executive Summary:
- Power BI Analytics enables organizations to transform raw business data into actionable insights through interactive dashboards, reports, and enterprise-grade analytics capabilities.
- Enterprises use Power BI to create a unified view of data across finance, operations, sales, customer service, and other business functions.
- Unlike traditional reporting approaches, Power BI analytics combines data visualization, self-service analytics, automation, and governance within a single platform.
- Power BI Service allows organizations to publish, share, collaborate, and manage analytics solutions securely across teams.
- Financial reporting is one of the most impactful Power BI use cases, helping CFOs move beyond spreadsheets toward trusted, audit-ready insights.
- Successful Power BI implementations depend on more than dashboards; they require strong data governance, semantic modeling, security frameworks, and alignment between business and IT teams.

Organizations today generate massive volumes of data across ERP systems, CRM platforms, applications, and operational tools. However, having access to data does not automatically translate into better decisions. Enterprises need analytics solutions that can convert fragmented information into accurate, timely, and business-relevant insights.
This is where Power BI Analytics enables a fundamental shift. Microsoft’s business intelligence platform helps organizations analyze data, create interactive dashboards, automate reporting, and establish a governed analytics environment that supports decision-making at every level.
From financial reporting and executive dashboards to operational monitoring and predictive insights, Power BI helps businesses move from reactive reporting to proactive intelligence. However, the success of a Power BI implementation depends on more than creating visually appealing reports. Organizations must build a strong foundation of data models, governance, security, and business alignment.
This complete Power BI analytics guide explores how enterprises can leverage Power BI analytics, its core capabilities, business applications, security considerations, and best practices for building trusted analytics environments.
“Information is the oil of the 21st century, and analytics is the combustion engine.”
– Peter Sondergaard, CEO & Member of Board, Horizon3
What Is Power BI Analytics?
Power BI Analytics is Microsoft’s business intelligence capability that enables organizations to connect, analyze, visualize, and share data-driven insights through interactive reports and dashboards.
At its core, Power BI analytics brings together data from multiple sources, transforms it into meaningful information, and presents insights through visual experiences that help business users make faster decisions.
Unlike traditional reporting systems that primarily focus on presenting historical data, Power BI enables organizations to explore trends, identify patterns, monitor key performance indicators (KPIs), and uncover opportunities across business functions.
A typical enterprise Power BI analytics environment consists of multiple layers:
| Component | Purpose |
|---|---|
| Data Sources | Connects with ERP systems, CRM platforms, databases, spreadsheets, cloud applications, and other business systems |
| Power Query | Cleans, transforms, and prepares data for analysis |
| Semantic Models | Creates structured business logic and relationships between datasets |
| DAX (Data Analysis Expressions) | Enables advanced calculations, measures, and financial/business logic |
| Reports and Dashboards | Converts analyzed data into interactive visual insights |
| Power BI Service | Enables publishing, sharing, collaboration, governance, and enterprise deployment |
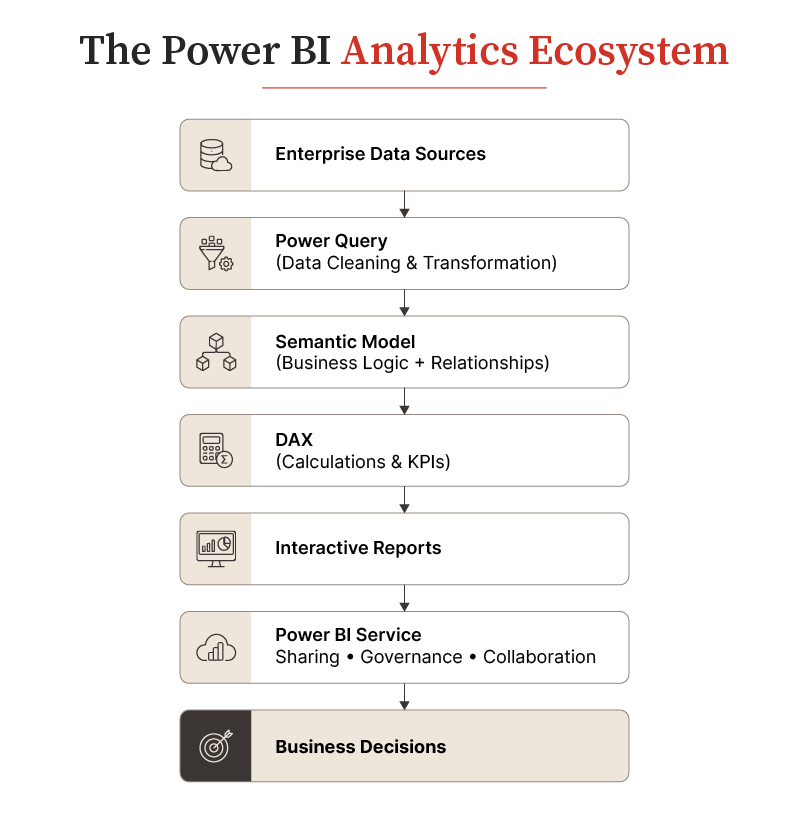
The value of Power BI lies not only in visualization but in creating a reliable analytical foundation where business users can access trusted information without depending entirely on manual reporting processes.
Why Is Power BI Analytics Different from Traditional Business Intelligence?
Traditional BI tools primarily answer what happened. Power BI analytics helps organizations understand why it happened, what it means, and what actions should follow.
Historically, business intelligence initiatives revolved around static reports that were generated periodically and distributed to business users. Any additional analysis required new report requests, manual data extraction, or spreadsheet manipulation. While these reports served operational needs, they rarely empowered business users to explore data independently.
Power BI changes this model by introducing governed self-service analytics. Instead of waiting for revised reports, decision-makers can interact with dashboards, drill into underlying data, compare trends across business units, and uncover insights in real time. The good news? All this can be done while working from certified datasets.
This capability becomes particularly valuable for executives who need immediate visibility into changing business conditions rather than retrospective reports. A CFO investigating declining profitability, a sales leader tracking regional performance, or an operations manager identifying production bottlenecks can all explore the same governed data environment without relying on separate reporting cycles.
Why Are Enterprises Adopting Power BI Analytics?
Enterprises are adopting Power BI analytics because it helps unify fragmented data, accelerate decision-making, and establish a scalable approach to business intelligence. Here’s a closer look:
1. Create a Single View of Business Performance
Large enterprises often operate across multiple departments, locations, and systems. Finance teams may rely on ERP data, sales teams may use CRM platforms, and operations teams may maintain separate reporting systems.
Without integration, these sources create multiple versions of business reality.
Power BI analytics helps organizations consolidate information from different systems into unified dashboards and reports. This enables executives and business teams to analyze performance using consistent definitions and trusted metrics.
2. Enable Faster, Data-Driven Decisions
Traditional reporting cycles often require teams to collect data manually, validate information, prepare spreadsheets, and distribute reports.
This process creates delays between when an event occurs and when decision-makers receive insights.
Power BI analytics reduces this dependency by automating data refreshes and providing real-time or scheduled visibility into critical metrics. Business leaders can identify performance changes earlier and respond faster.
3. Reduce Manual Reporting Effort
Finance and business teams often spend significant time maintaining Excel files, updating formulas, reconciling numbers, and preparing presentation-ready reports.
By automating data preparation and reporting workflows, Power BI enables teams to focus more on analysis rather than data collection.
However, automation alone does not guarantee success. Organizations must ensure that the underlying data models, business rules, and governance frameworks are properly designed.
In fact, 74% of organizations surveyed reported investing in AI and generative AI capabilities over the past year, making AI and data-driven technologies the leading investment priority among the technology capabilities evaluated.1 This highlights why enterprises are strengthening their analytics foundations to support smarter decision-making and future AI adoption.
Case in Focus: From Fragmented Data to Smarter Retail Decisions
Challenge: A multi-door retailer relied on Excel spreadsheets and fragmented data sources, making it difficult to access timely insights into sales, inventory, customer behavior, and store performance.
Solution: The retailer implemented Power BI dashboards that integrated data from Excel, POS, and other sources, enabling drill-down analysis across products, stores, geographies, employees, and customer segments.
Result: The solution reduced inventory costs by around 30%, saved hundreds of hours annually, and improved collaboration by giving teams a unified view of business performance.
Looking to Unify Fragmented Enterprise Data Into a Governed Analytics Ecosystem?
What Are the Core Capabilities of Power BI Enterprise Analytics?
Power BI enterprise analytics combines data integration, advanced modeling, visualization, collaboration, and governance capabilities to support organization-wide decision-making.
I. Data Integration Across Enterprise Systems
Power BI can connect with a wide range of enterprise data sources, including databases, cloud applications, business applications, and files. This connectivity enables organizations to bring together operational, financial, customer, and market data within a centralized analytics environment.
By integrating multiple data sources, organizations can analyze relationships between different areas of the business rather than viewing each function independently.
II. Advanced Data Modeling and Business Logic
Reliable analytics depends on accurate data modeling. Power BI semantic models allow organizations to define relationships between datasets, establish business calculations, and create consistent metrics across reports. This is especially important for complex enterprise scenarios such as financial reporting.
Most Power BI financial reporting challenges occur when organizations treat financial data as a simple dataset rather than building models that reflect business processes.
III. Interactive Dashboards and Self-Service Analytics
Power BI enables business users to interact with reports rather than passively consume static documents. Users can filter information based on business need, drill into underlying details, and compare performance across periods. They can also identify trends and anomalies and explore data without creating new reports.
However, successful self-service analytics requires governance. Without clear standards, organizations can quickly create multiple dashboards with inconsistent metrics.
IV. Power BI Service for Enterprise Collaboration
Power BI Service is the cloud-based platform that enables organizations to publish, share, manage, and govern Power BI reports across teams. While Power BI Desktop is primarily used for report creation and data modeling, Power BI Service supports enterprise deployment.
Organizations use Power BI Service to publish reports and dashboards, manage workspaces, control access permissions, and schedule data refreshes. They can also share insights securely and monitor usage and adoption.
For enterprise environments, Power BI Service acts as the operational layer that transforms individual reports into scalable analytics solutions.
How Does Power BI Transform Financial Reporting and Executive Analytics?
Power BI transforms financial reporting by connecting financial data, automating recurring reports, and giving finance leaders an interactive, governed view of business performance. Consider a finance team that spends months building its Power BI environment. The dashboards look sharp, drill-through works, and leadership approves the implementation. Then month-end arrives, and the CFO opens the familiar Excel workbook to validate the numbers.
This scenario highlights an important distinction: Power BI adoption is not the same as Power BI trust.
For finance leaders, a dashboard is valuable only when its numbers are accurate, explainable, timely, and relevant to the decisions being made. This is why financial reporting is a useful test of enterprise analytics maturity. It exposes whether Power BI is simply visualizing information or creating a decision environment executives can genuinely rely on.
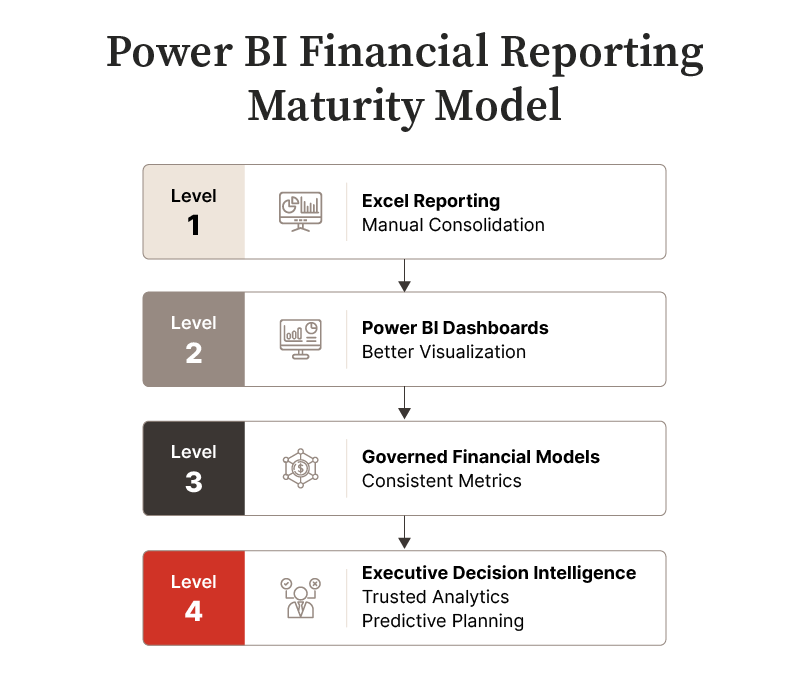
Microsoft itself positions Power BI as a platform for turning data into actionable insights, while its financial-process guidance highlights automated recurring data and interactive dashboards as ways to reduce manual gathering and reporting.
What Is Power BI Financial Reporting?
Power BI financial reporting uses governed financial data and business intelligence capabilities to create interactive P&L statements, balance sheets, cash flow reports, variance analyses, and executive dashboards.
Traditional financial reporting is largely retrospective. It tells finance leaders what happened during a particular reporting period. Financial analytics goes further by helping them investigate why performance changed and where attention is required.
| Financial Reporting | Financial Analytics |
|---|---|
| Explains what happened | Explores why it happened |
| Uses structured financial statements | Enables interactive analysis |
| Focuses on historical performance | Identifies trends and business drivers |
| Supports compliance and periodic review | Supports planning and decision-making |
| Often uses fixed reporting formats | Enables drill-down and contextual analysis |
Power BI brings these two capabilities together. A CFO can review consolidated revenue or margin at the enterprise level and then investigate performance by entity, region, product, or another relevant business dimension without waiting for a new spreadsheet extract.
This does not mean Excel disappears from finance. Rather, Power BI can reduce dependence on spreadsheet-heavy reporting where manual consolidation, duplicated calculations, and multiple report versions make enterprise-scale reporting harder to govern.
What Do Most Power BI Financial Reporting Implementations Get Wrong?
Power BI financial reporting implementations fall short when organizations prioritize dashboards before establishing decision requirements, accounting logic, trusted data models, and governance. Four issues deserve particular attention:
1. Dashboard-First Thinking
Teams frequently begin with available data and build visuals around it. But displaying everything available is not the same as showing what matters. A better starting point is identifying the recurring decisions finance leadership makes and designing analytics around the information required for those decisions.
2. Weak Financial Modeling
A P&L is not a regular data table. Financial statements contain hierarchies, calculated lines, subtotals, period comparisons, and accounting conventions. If these structures are not modeled correctly, even a minor discrepancy can undermine confidence in the entire environment.
3. Multiple Versions of Truth
When ERP reports, Power BI dashboards, and parallel Excel workbooks produce different numbers, executives stop debating performance and start debating which number is correct. Certified semantic models and governed metric definitions are therefore fundamental to establishing one trusted view.
4. Governance as an Afterthought
Security, lineage, ownership, and auditability cannot wait until deployment is complete. For financial analytics, governance is part of the architecture rather than a post-launch enhancement.
Simply put, Power BI financial reporting succeeds when executives no longer feel the need to validate the dashboard against the spreadsheet.
McKinsey’s State of AI 2025 survey found that 88% of respondents reported that their organizations are using AI in at least one business function.2 But many organizations are still in the early stages of scaling AI across the enterprise. The finding reinforces the importance of strong data governance and analytics foundations before organizations can fully capture value from advanced technologies.
Build a Power BI Financial Reporting Environment That Finance Leaders Can Trust
Where Can Enterprises Apply Power BI Analytics Beyond Finance?
Power BI Analytics can extend across sales, operations, customer experience, workforce management, and other functions, creating a common intelligence layer across the enterprise. Here’s a closer look:
A. Sales
In sales analytics, leaders can move beyond static pipeline reports to examine conversion performance, sales velocity, revenue trends, and regional variations. Instead of discovering a missed target at quarter-end, teams can investigate emerging performance gaps while there is still time to intervene.
B. Operations
For operations, Power BI can bring together production, procurement, inventory, and process data to expose inefficiencies that are difficult to identify when these systems operate independently. Decision-makers gain visibility into where bottlenecks are forming and which operational variables influence performance.
C. Customer Services
In customer analytics, organizations can combine information across interactions, transactions, and service channels to develop a more connected view of customer behavior. This helps leaders identify retention patterns, service issues, and opportunities for improving customer value.
D. Human Resources
Workforce analytics can give leadership visibility into organizational capacity, workforce trends, resource utilization, and productivity indicators when appropriate data and access controls are established.
The strategic advantage is not that Power BI can produce a dashboard for each department. It is that these functions can increasingly operate from a shared analytical foundation, allowing leaders to understand how a change in one part of the enterprise affects another.
“The greatest value of a picture is when it forces us to notice what we never expected to see.”
– John W. Tukey, Mathematician and Statistician
The principle applies directly to enterprise analytics: visualization creates business value when it exposes relationships, anomalies, or opportunities that change the way a decision is made.
How Does Power BI Compare with Traditional BI and Reporting Tools?
Power BI combines self-service analytics, enterprise governance, data modeling, visualization, and Microsoft ecosystem integration, while alternative tools may be stronger for particular reporting or visualization requirements.
There is no universally superior BI platform. The appropriate choice depends on the organization’s existing technology environment, analytics maturity, governance requirements, skills, and use cases.
| Platform | Where It Excels | Enterprise Consideration |
|---|---|---|
| Power BI | Integrated analytics, semantic modeling, self-service BI, Microsoft ecosystem integration | Requires disciplined governance as adoption scales |
| Tableau | Rich visual exploration and interactive data discovery | Platform fit depends on existing architecture and governance requirements |
| Qlik | Associative analytics and flexible data exploration | May require specialized platform expertise |
| Excel | Flexible calculations, ad hoc analysis, and widespread finance familiarity | Difficult to govern as the primary enterprise reporting layer |
| SSRS | Structured and paginated operational reporting | Better suited to fixed reporting than exploratory analytics |
The important question is therefore not simply “Which BI tool has more features?”
Enterprise leaders should instead ask: Which platform fits our data architecture, governance model, user ecosystem, and decision-making requirements?
For organizations already operating extensively within the Microsoft technology ecosystem, Power BI can reduce friction between analytics, collaboration, data management, and information governance. But that advantage can only be realized when the implementation itself is designed to scale.
How Does Power BI Ensure Enterprise Security and Governance?
Power BI addresses security concerns through layered security controls, centralized governance, and Microsoft ecosystem integrations that help organizations balance accessibility with compliance.
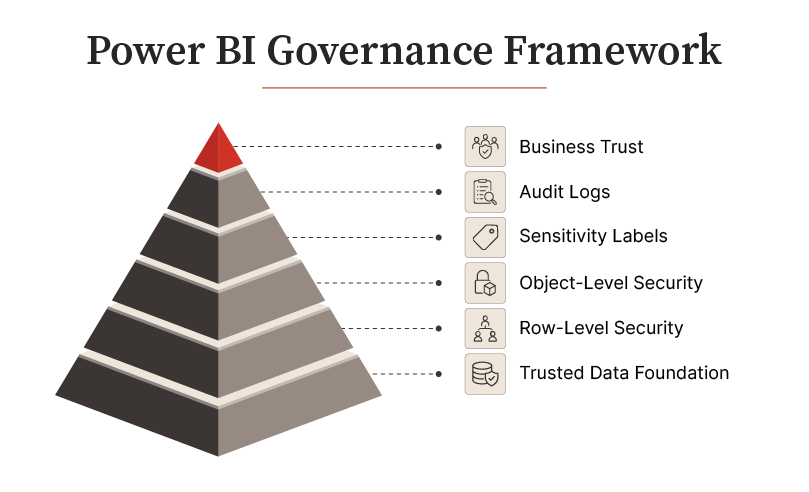
As analytics adoption grows, so does the volume of sensitive information flowing through reporting platforms. Without appropriate governance, organizations risk creating multiple versions of the truth, exposing confidential data, and undermining confidence in analytics.
Here’s a closer look:
- Row-Level Security (RLS) restricts data access based on user roles, allowing organizations to present different views of the same report without creating multiple versions.
- Object-Level Security (OLS) extends this protection by controlling access to specific tables or columns within a semantic model. This enables organizations to safeguard highly sensitive information while keeping the broader analytical model intact.
- Power BI also supports Sensitivity Labels, enabling organizations to classify reports and datasets according to their confidentiality levels. This becomes particularly valuable for regulated industries where financial information, customer records, or strategic business plans require additional protection.
- To strengthen accountability, Audit Logs record user activities such as report access, data exports, and administrative changes. These logs support compliance initiatives while providing administrators with greater visibility into how analytics assets are being used across the organization.
- Power BI’s integration with Microsoft Purview further enhances governance by enabling organizations to understand data lineage, classify information assets, and manage enterprise-wide data governance policies. Together with structured workspace governance, these capabilities help organizations maintain trusted analytics environments as adoption scales.
PwC’s 2025 global survey found that only 14% of respondents were using generative AI daily at work, while daily users reported stronger productivity benefits compared with less frequent users.3 The findings highlight that organizations need structured adoption strategies, reliable data environments, and effective governance to translate emerging technologies into business value.
What Are the Best Practices for Implementing Power BI Analytics Successfully?
Successful Power BI implementations combine business alignment, trusted data, governance, and adoption to deliver measurable value.
- Business-First Approach: Focus on key decisions, metrics, and stakeholder needs before building dashboards to ensure analytics supports business outcomes.
- Trusted Data Foundation: Standardize metric definitions, create certified semantic models, and document business rules so teams work from a single source of truth.
- Built-In Governance: Establish data ownership, access controls, report certification, workspace standards, and data lineage from the start.
- Balanced Self-Service: Enable user exploration through approved datasets, certified reports, common definitions, and governance controls.
- Impact Measurement: Track outcomes such as faster decisions, reduced reporting effort, improved accuracy, and stronger collaboration rather than dashboard volume.
Accelerate Enterprise Decision-Making with Secure, Governed Power BI Analytics Solutions
Conclusion
Power BI Analytics has evolved from a business intelligence tool into a strategic decision-support platform that unifies data, governance, and analytics.
Beyond dashboards and automated reporting, it helps organizations create a trusted analytical foundation by integrating data sources, standardizing business definitions, enforcing governance, and enabling secure self-service analytics.
This allows decision-makers to access reliable insights and act with greater confidence and speed. In financial reporting, governed semantic models and embedded accounting logic improve accuracy, consistency, and executive trust.
As enterprise data grows in complexity, Power BI provides a scalable, secure foundation for delivering accurate insights and supporting informed business decisions.
References:
- [1]: https://www.deloitte.com/us/en/insights/topics/digital-transformation/ai-tech-investment-roi.html
- [2]: https://www.mckinsey.com.br/capabilities/quantumblack/our-insights/the-state-of-ai
- [3]: https://www.pwc.com/gx/en/news-room/press-releases/2025/pwc-2025-global-workforce-survey.html
Frequently Asked Questions
Power BI Analytics is used to transform data from multiple business systems into interactive reports, dashboards, and analytical insights that support informed decision-making. Organizations commonly use it for financial reporting, sales performance analysis, operational monitoring, customer analytics, executive dashboards, and enterprise reporting.
Traditional BI tools primarily focus on generating predefined reports, whereas Power BI combines data integration, interactive visualization, self-service analytics, and enterprise governance within a single platform. This enables users to explore data, investigate trends, and collaborate securely while working from consistent, governed datasets.
Yes. Power BI supports enterprise financial reporting through certified semantic models, advanced DAX calculations, automated reporting, role-based security, and audit-ready governance. These capabilities help finance teams create accurate, interactive financial reports while reducing reliance on manual spreadsheet processes.
Power BI protects enterprise data through multiple security and governance capabilities, including Row-Level Security (RLS), Object-Level Security (OLS), Sensitivity Labels, Audit Logs, Microsoft Purview integration, workspace governance, and role-based access controls. Together, these features help organizations safeguard sensitive information while enabling secure collaboration across business teams.

